Once you have completed your nested pit analysis you may have several dozen pits that do not vary in tonnage smoothly. That is, there may be uneven jumps in the tonnage graph as new areas of the pit become economic all of a sudden. This can be seen in the pit by pit graph below.
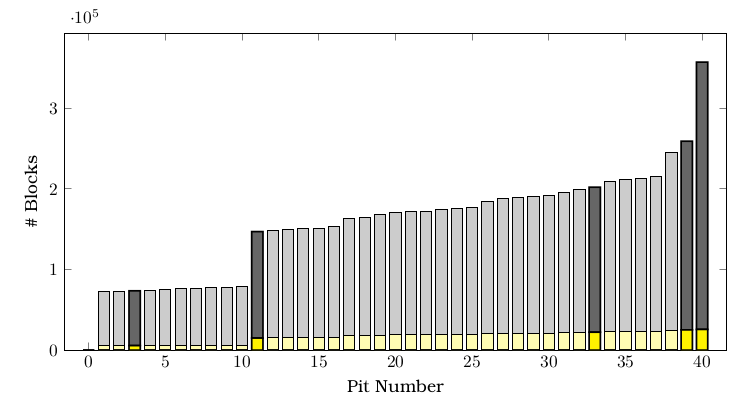
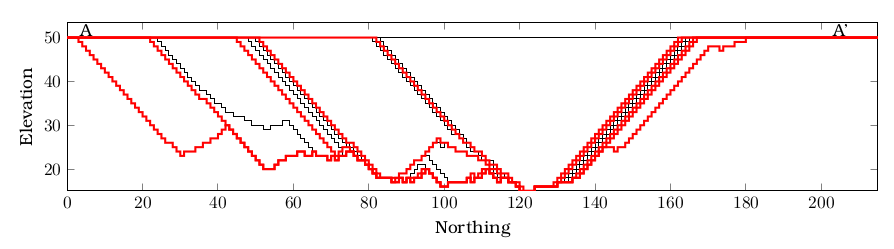
In the same graph notice how five of the bars are darker. These bars correspond to five nested pits which have been selected as phases and are shown in red in the vertical cross section below.
Selecting those phases is commonly done by hand by looking at the list of tonnages or the pit by pit graph and choosing which ones are roughly evenly spaced. Which is altogether a rather savage way of doing things. I developed an algorithm which optimally selects some of the nested pits to serve as evenly spaced phases.
This algorithm is available for purchase by email.
matthewvdeutsch@gmail.com - © Matthew Deutsch. All rights reserved.